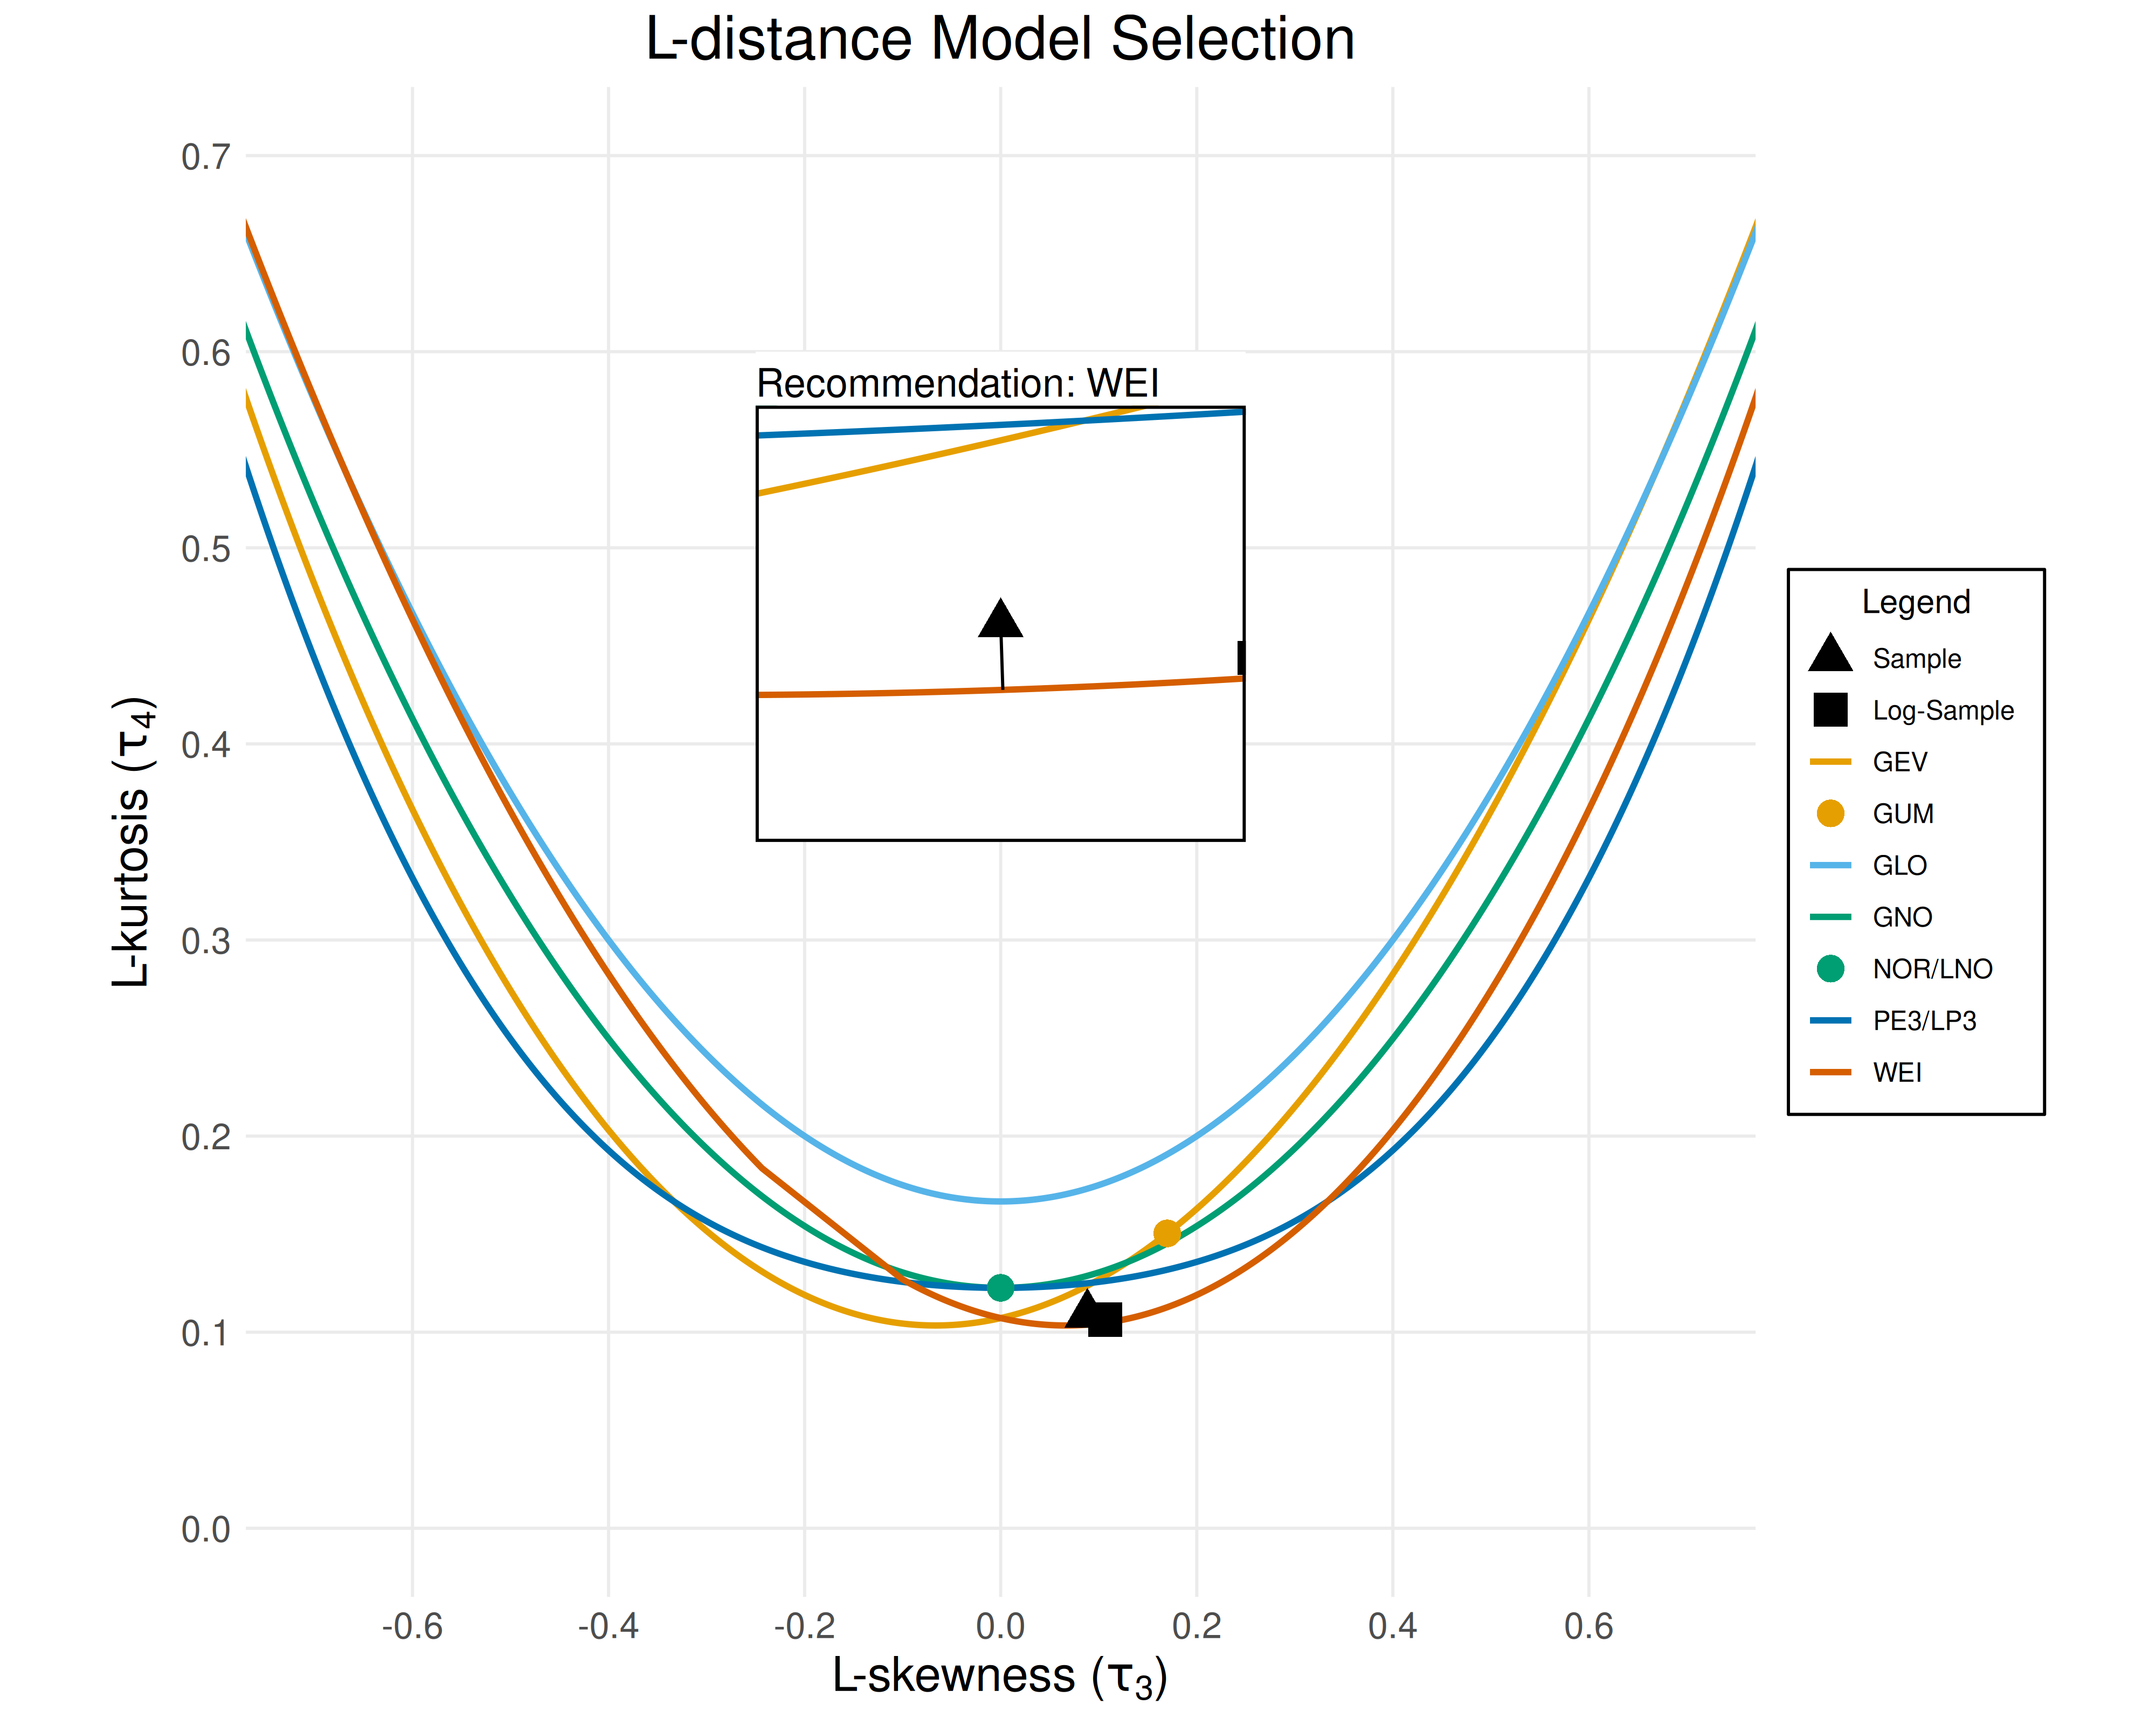
Generates a plot of L-moment ratios with the L-skewness on the x-axis and L-kurtosis on the y-axis. Plots the sample and log-sample L-moment ratios alongside the theoretical L-moment ratios for a set of candidate distributions. Also includes a small inset around the L-moment ratios of the recommended distribution.
Arguments
- results
List of distribution selection results generated by
select_ldistance(),select_lkurtosis(), orselect_zstatistic().- ...
Optional named arguments: 'title', 'xlabel', and 'ylabel'.
Value
ggplot; plot object containing the L-moment ratio diagram, with:
L-moment ratio curves for each 3-parameter distribution.
Points for the L-moment ratios of each 2-parameter distribution.
Sample and log-sample L-moment ratio \((t_3, t_4)\) points.
Examples
data <- rnorm(n = 100, mean = 100, sd = 10)
results <- select_ldistance(data)
plot_lmom_diagram(results)