Exploratory Data Analysis (EDA)
Source:vignettes/articles/eda-introduction.Rmd
eda-introduction.RmdThe EDA module of the FFA Framework is used to evaluate whether the available evidence supports the assumption of stationarity. To do this, the EDA module applies a structured sequence of statistical tests to the data to detect statistically significant nonstationary signatures. These statistical tests serve three purposes:
- Detect change points (i.e., abrupt shifts or trend changes).
- Detect trends in the mean and identify them as deterministic/stochastic, linear/non-linear.
- Detect trends in the variability (i.e., heteroskedasticity and trends in standard deviation).
The primary goal of EDA is to inform the choice between stationary and nonstationary FFA.
Stationary and Nonstationary FFA
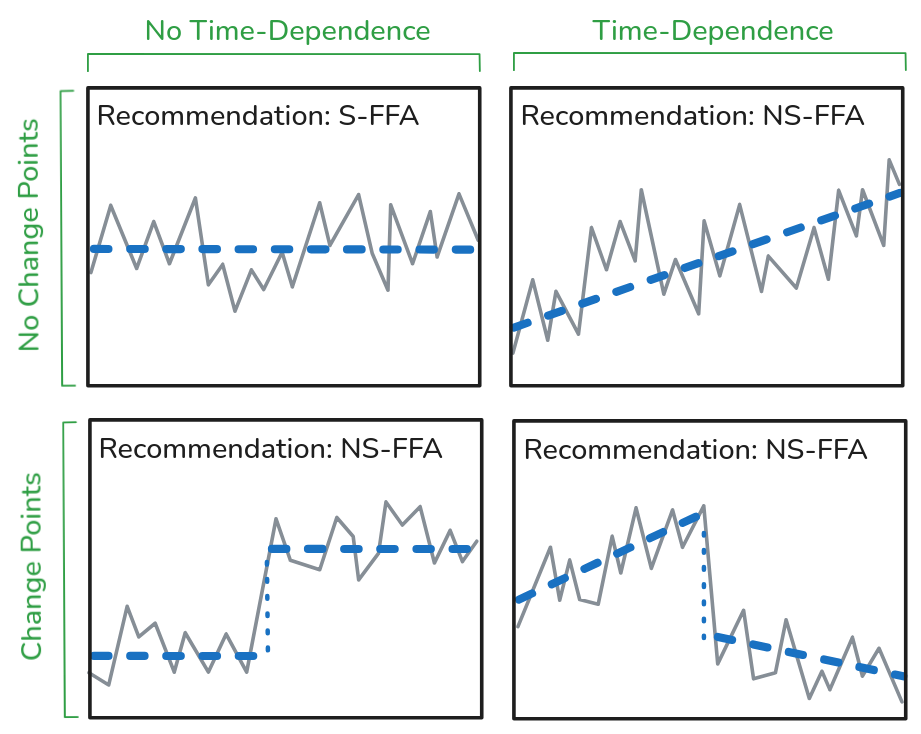
Prior to performing FFA, it is necessary to choose between a stationary (S-FFA) and nonstationary (NS-FFA) approach. When using S-FFA, it is assumed that the time series is independent and identically distributed. Evidence of change point(s) and/or time dependence violates the assumptions of stationarity and indicates that NS-FFA may be necessary.
The EDA Workflow
Identifying Change Points
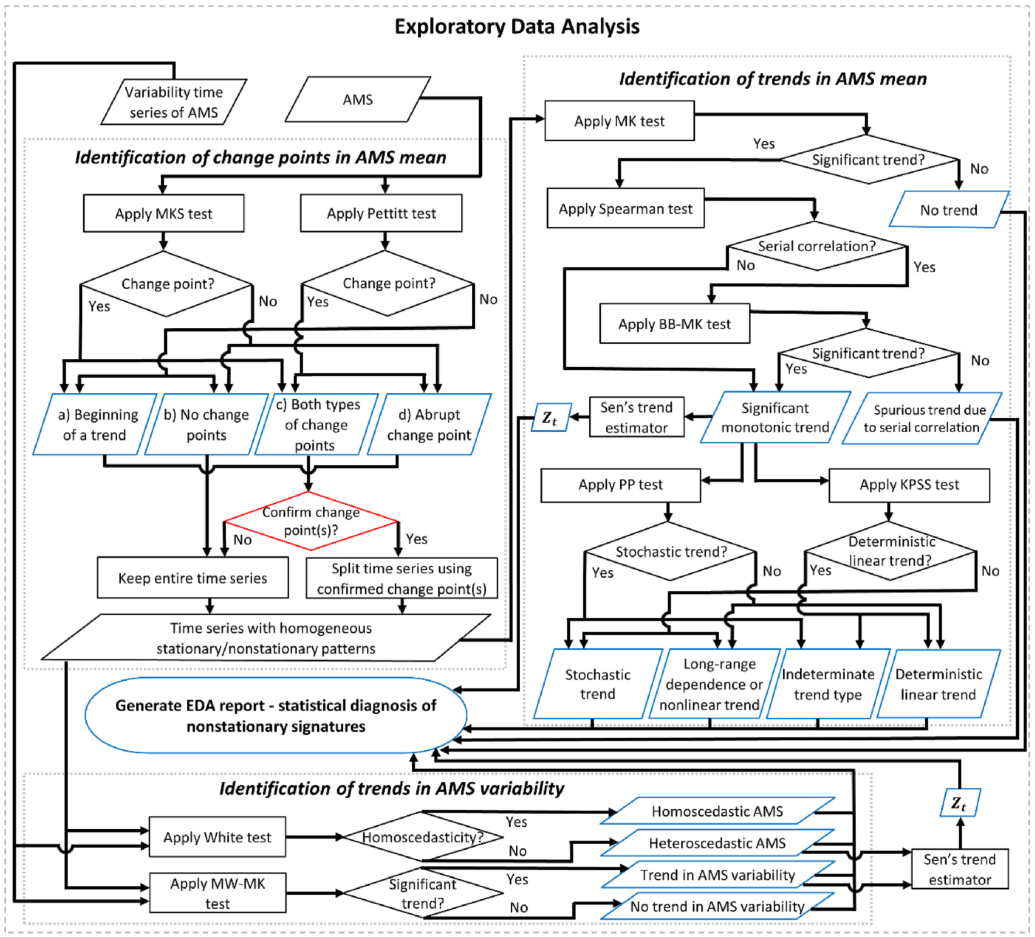
A change point is an abrupt shift (jump) or temporal pattern switch (trend change) in a time series. Change points indicate inhomogeneous periods (nonstationarity), meaning a single model may not represent the entire record adequately. Instead, piecewise analysis should be applied to each homogeneous subperiod.
The Pettitt test and MKS test are used to identify abrupt shifts and temporal pattern switches respectively. However, a statistically significant result from one or both of these tests does not conclusively identify a change point. Type 1 errors and issues with data quality can cause the Pettitt and MKS tests to identify spurious change points, while type 2 errors can cause true change points to go unnoticed. Therefore, it is always important to use station-specific knowledge in addition to the results of these tests.
Identifying Time Dependence
While there are many types of time dependence, the FFA framework focuses on identifying linear trends in the mean and/or variability using two groups of statistical tests.
Identifying trends in the mean: First, the Mann-Kendall test is used to identify evidence of a linear trend in the mean. If a trend is identified, the Spearman test is used to check for evidence of autocorrelation, which is known to cause issues with the Mann-Kendall test. If autocorrelation is identified, the BB-MK test is used in place of the Mann-Kendall test to identify a linear trend in the mean. Finally, if a trend is identified, the PP and KPSS tests are used to check if the trend is deterministic or stochastic.
Identifying trends in the variability: The variability of a time series can be estimated by computing the sample standard deviation over sequential subsets of the data (a moving window). The MW-MK test applies the Mann-Kendall test to this variability time series to identify a linear trend. The White test is also used to identify general time-dependence (e.g. nonlinear trends) in the variability.
Trend estimation: Sen’s trend estimator is a robust, nonparametric estimator used to estimate a linear trend. It can be applied to trends in the mean and the variability. Once a linear trend has been estimated, its fit can be assessed using the runs test, which checks for randomness in the residuals. If the residuals are non-random, a linear trend may not be suitable for the data.