Generates a histogram of bootstrapped Mann–Kendall S‐statistics with vertical lines indicating the observed S‐statistic and confidence bounds.
Arguments
- results
List of BB‐MK test results generated by
eda_bbmk_test().- ...
Optional named arguments: 'title', 'xlabel', and 'ylabel'.
Value
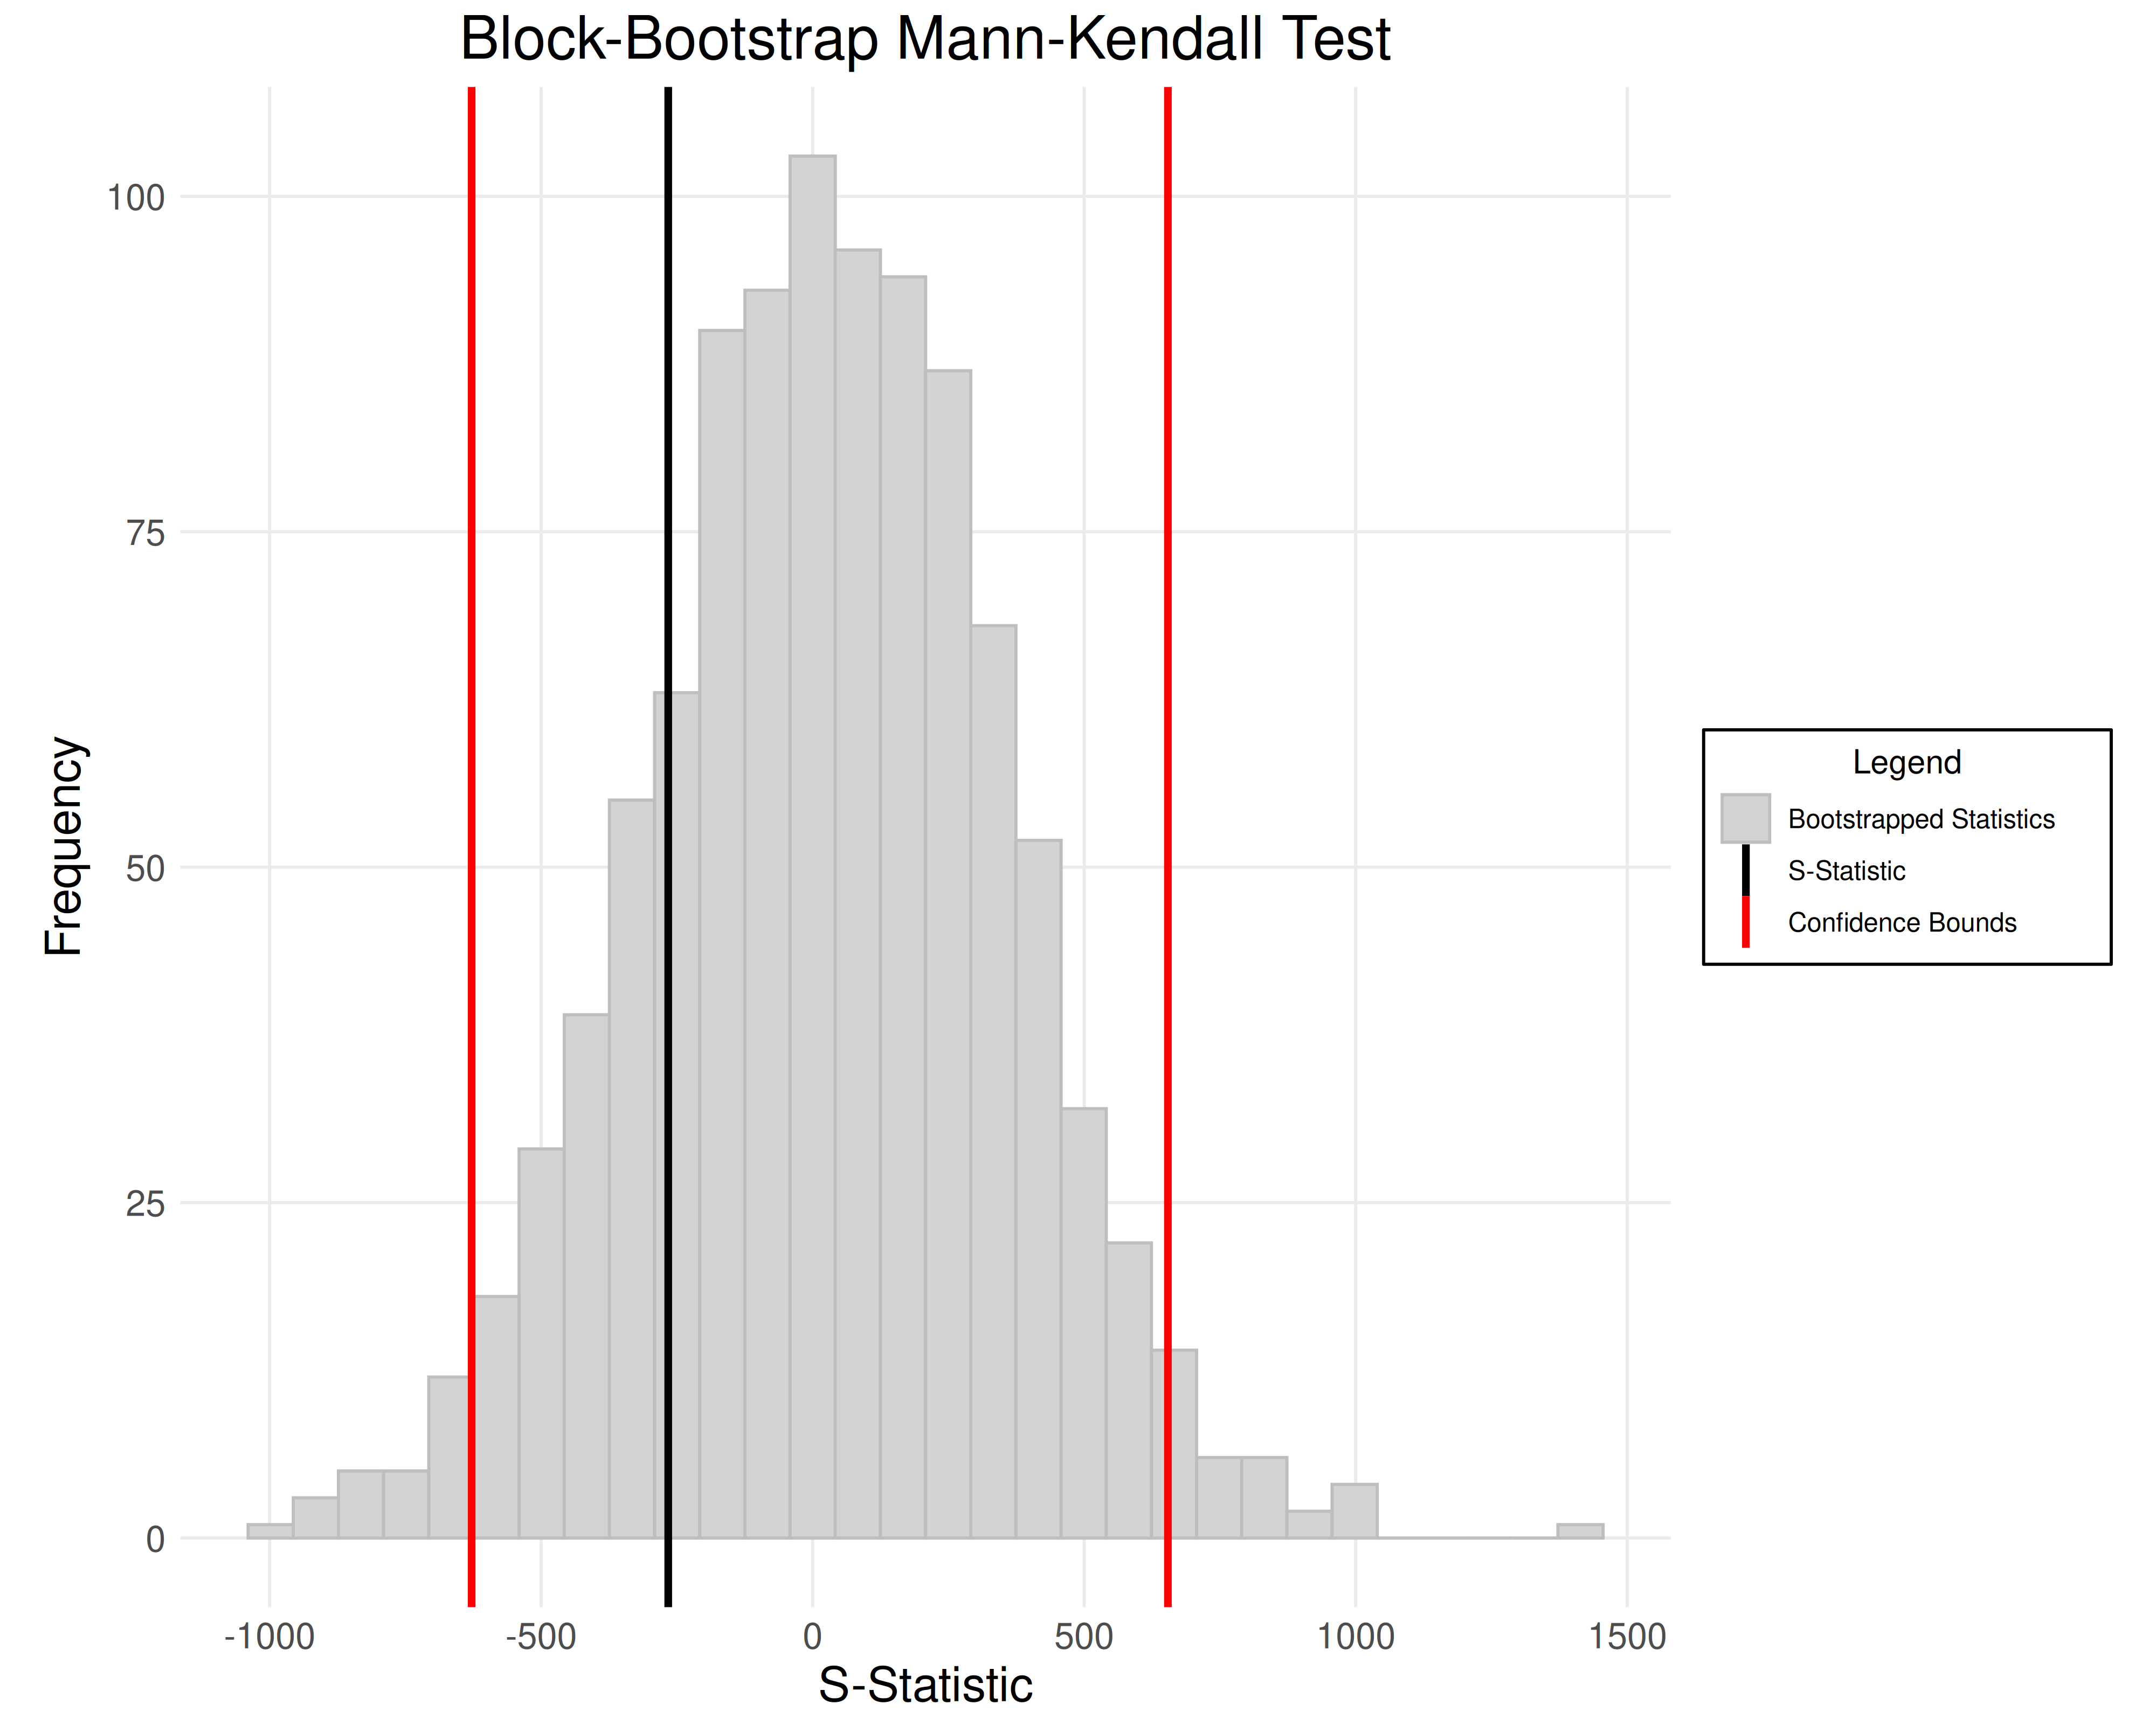
ggplot; A plot containing:
A gray histogram of the distribution of bootstrapped S‐statistics.
A red vertical line at the lower and upper confidence bounds.
A black vertical line at the observed S‐statistic.
Examples
data <- rnorm(n = 100, mean = 100, sd = 10)
results <- eda_bbmk_test(data, samples = 1000L)
plot_bbmk_test(results)