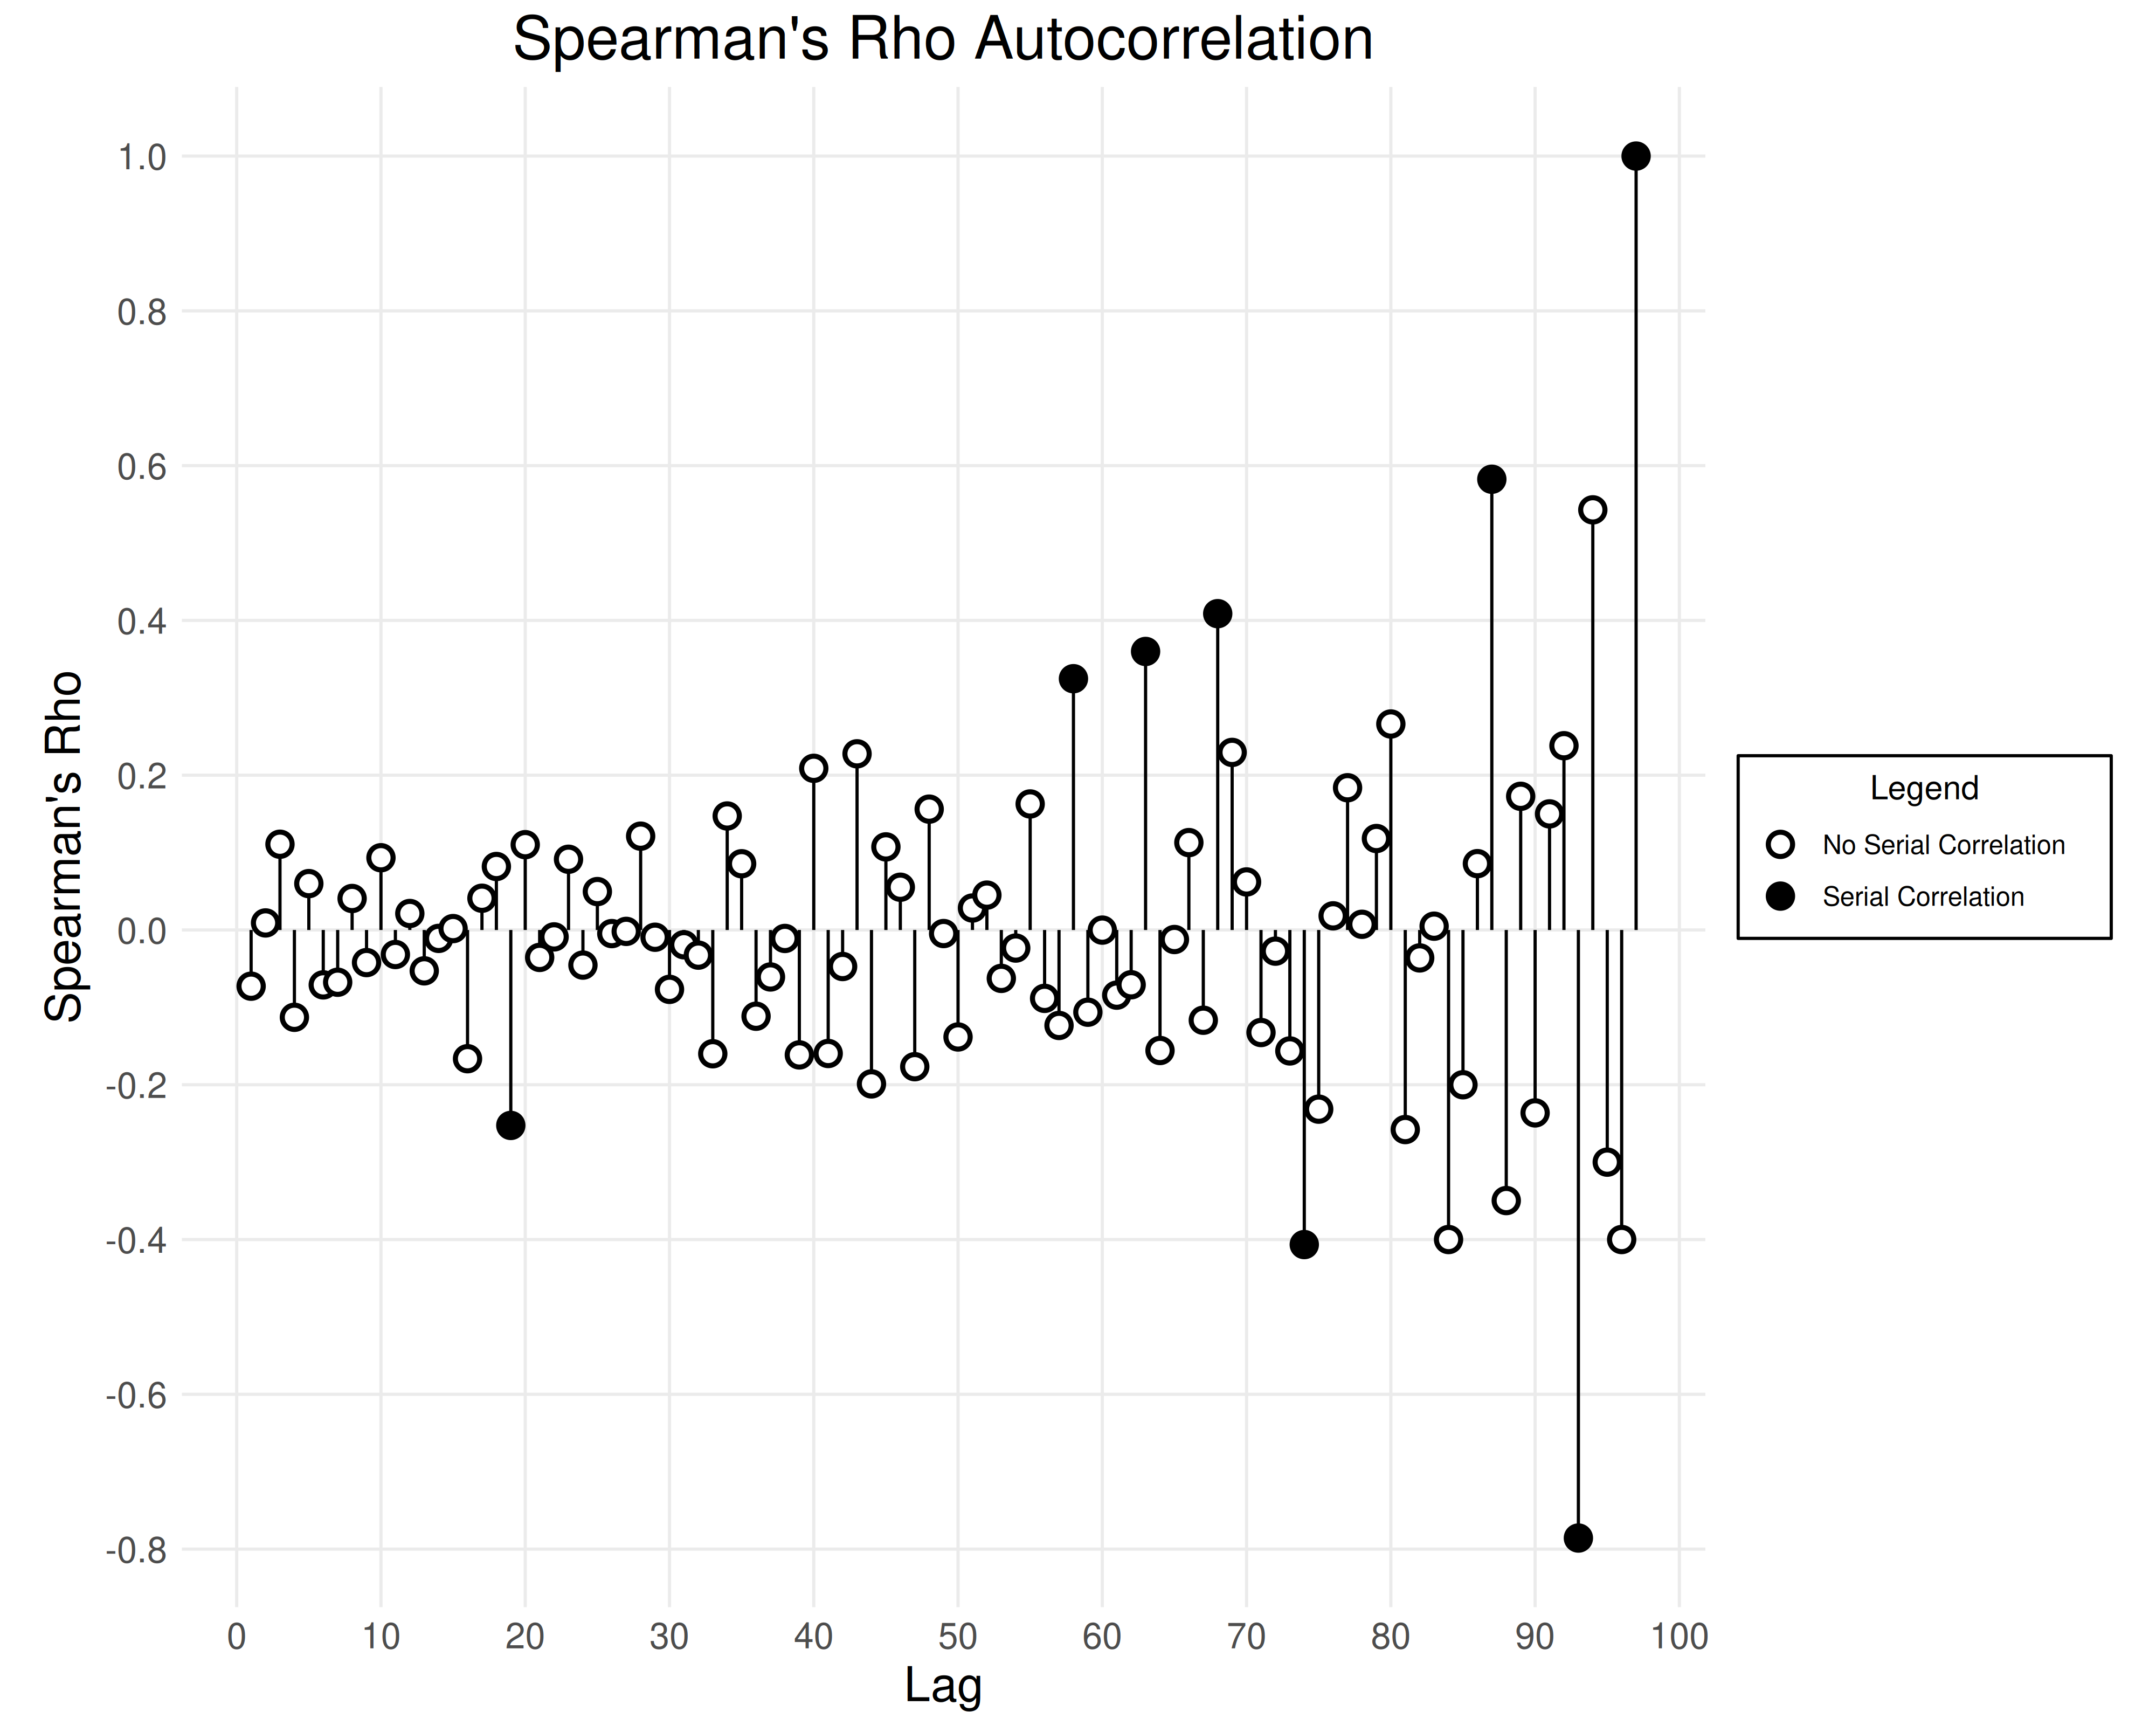
Visualizes Spearman’s rho serial correlation coefficients with shaded points indicating statistical significance.
Arguments
- results
A list generated by
eda_spearman_test().- ...
Optional named arguments: 'title', 'xlabel', and 'ylabel'.
Value
ggplot; a plot showing:
Vertical segments from \(y=0\) up to each \(\rho\) value at its lag.
Filled circles at each lag, filled black if serial correlation is detected.
Examples
data <- rnorm(n = 100, mean = 100, sd = 10)
results <- eda_spearman_test(data)
plot_spearman_test(results)