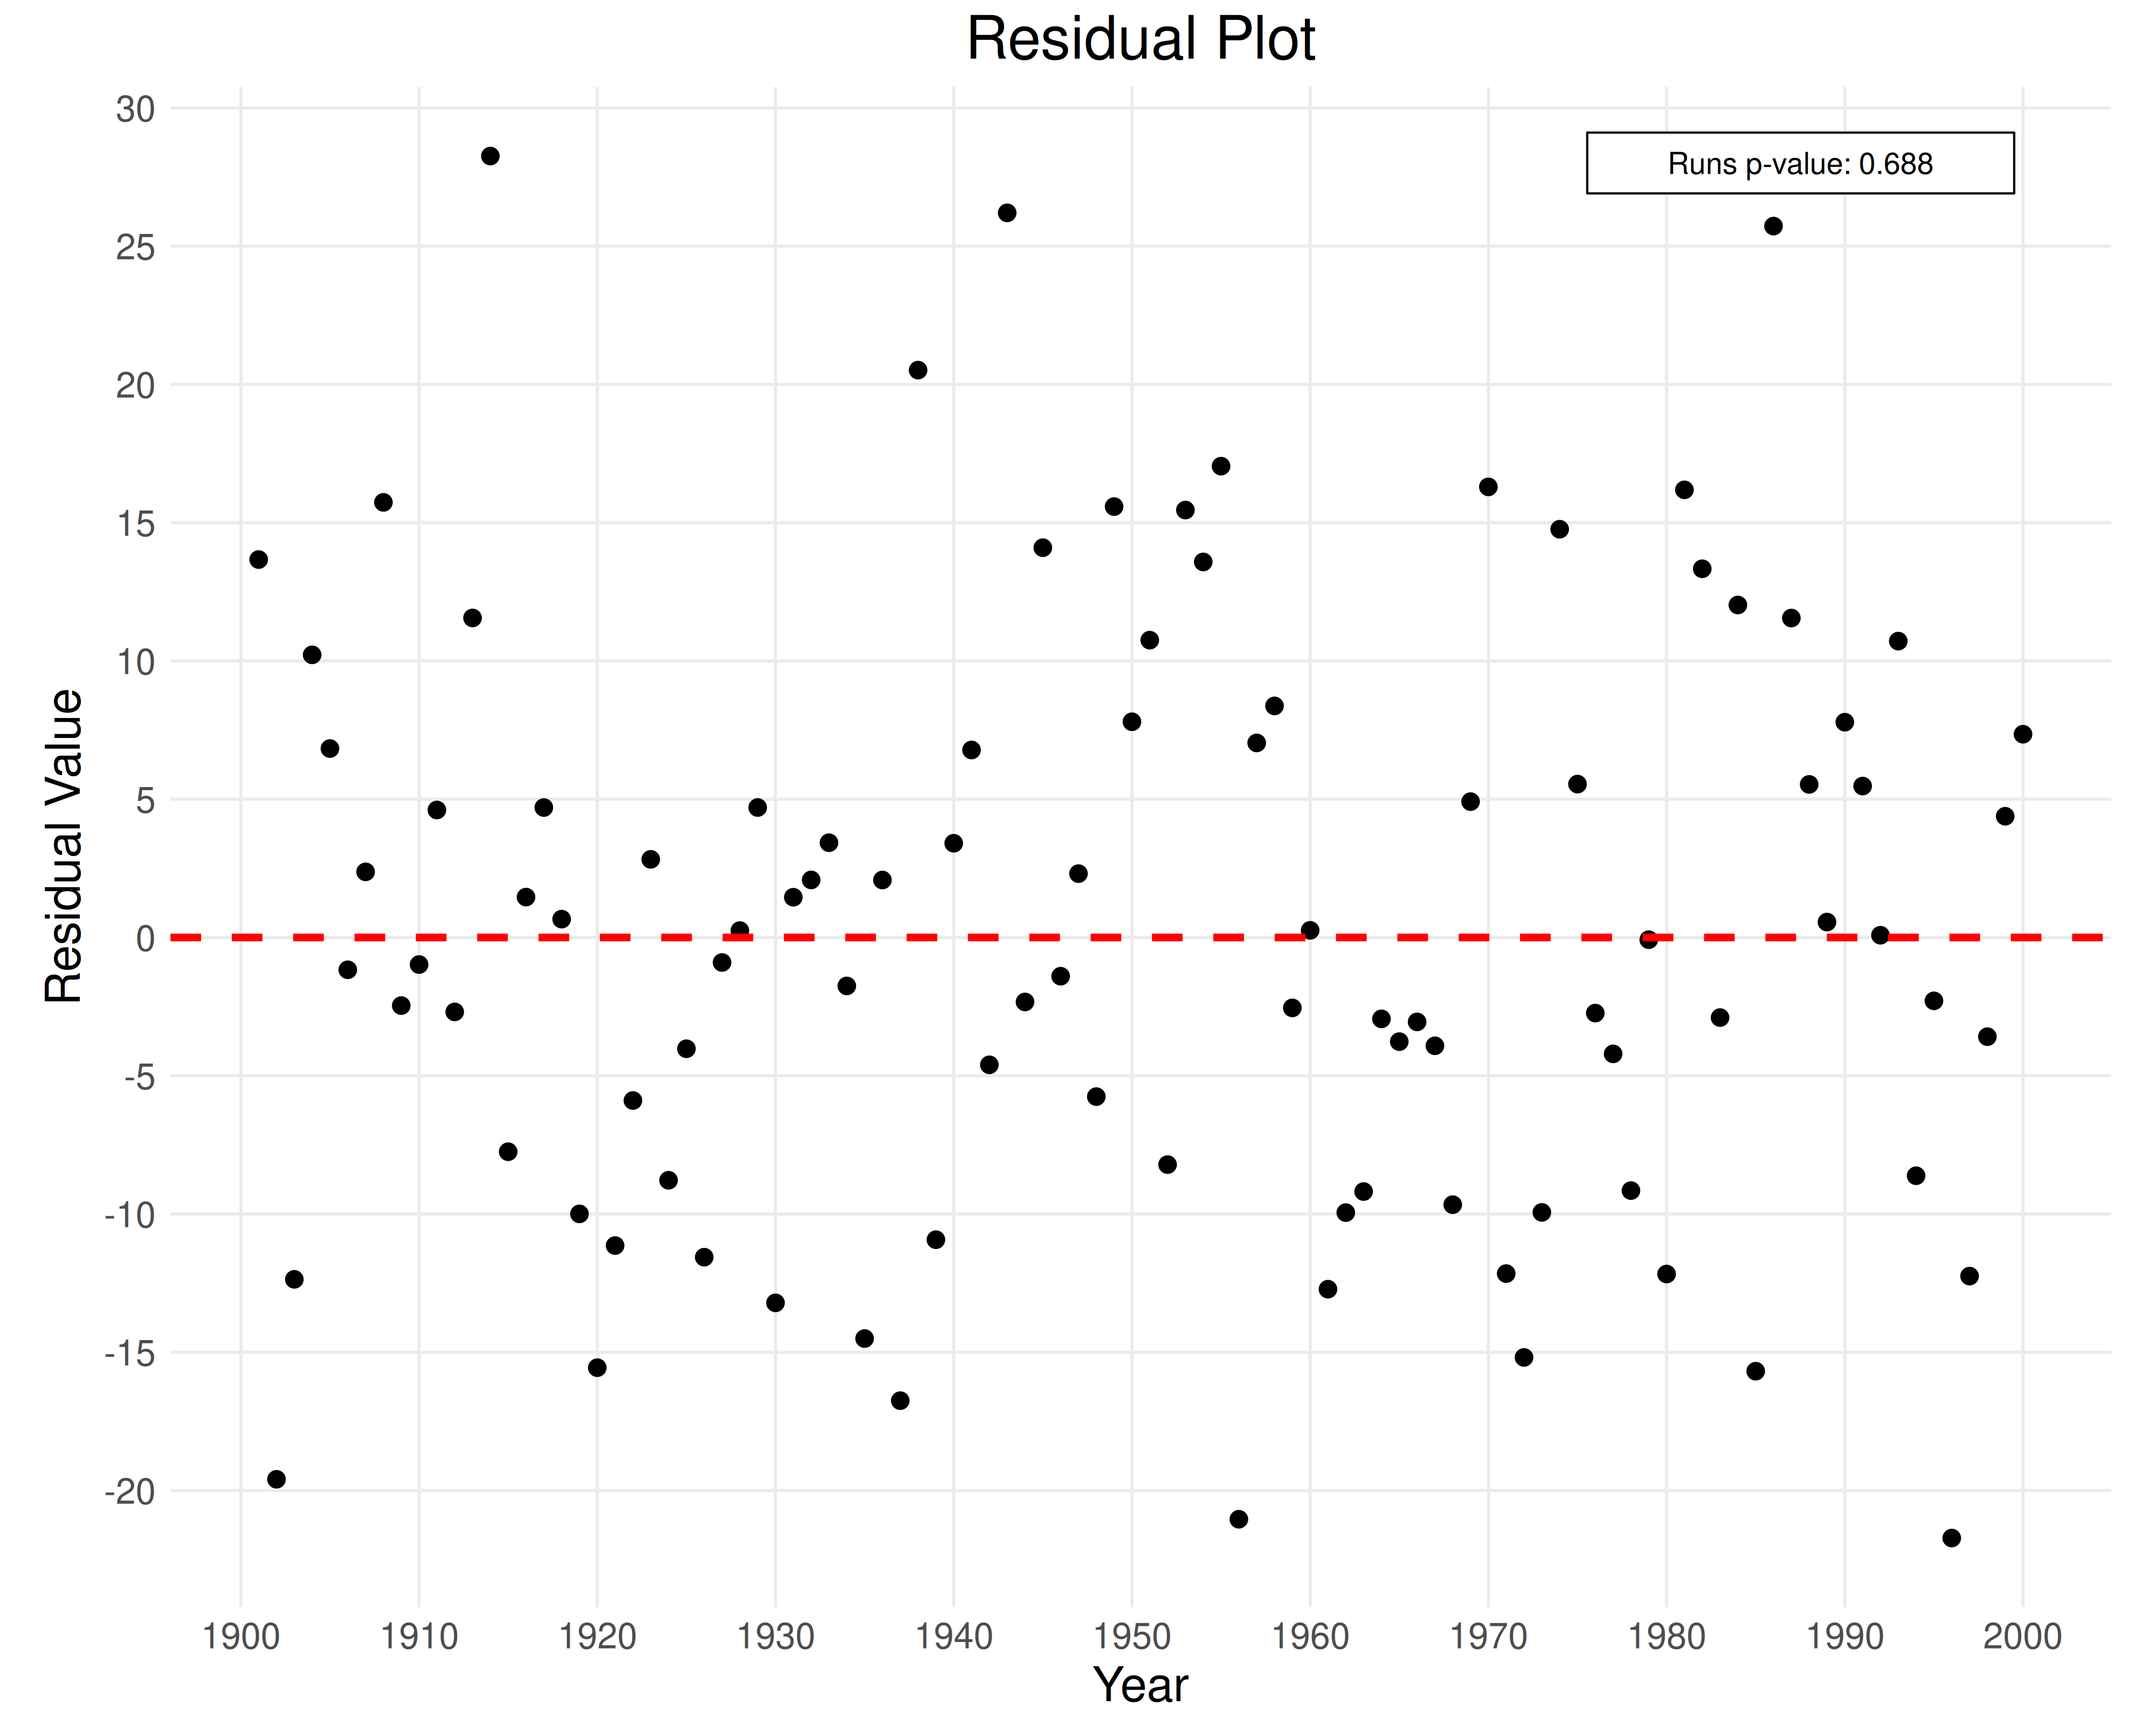
Generates a residual plot of Sen's estimator applied to annual maximum series data (or the variability of the data) with a horizontal dashed line at zero and an annotation indicating the p-value of the Runs test.
Arguments
- results
A list of runs test results generated by
eda_runs_test().- ...
Optional named arguments: 'title', 'xlabel', and 'ylabel'.
Value
ggplot; a plot containing:
Black points for the residual at each year.
A red dashed horizontal line at \(y = 0\).
A text annotation “Runs p-value: X.XXX” in the plot area.
Examples
# Initialize data and years
data <- rnorm(n = 100, mean = 100, sd = 10)
years <- seq(from = 1901, to = 2000)

# Generate the runs test plot
sens_trend <- eda_sens_trend(data, years)
results <- eda_runs_test(sens_trend$residuals, years)
plot_runs_test(results)